The “Open Source SAR Investigation System” (OSARIS) is a framework facilitating interferometric processing of large stacks of Sentinel-1 (S1) Synthetic Aperture Radar (SAR) in parallelized HPC environments. Basing on BASH scripts, GMTSAR and SLURM, it is highly flexible and scales to extremely high performance on large clusters.
Core features included to date are:
- Modular structure, allowing to include additional scripts after each processing step.
- Automatic data preparation, including download of scenes and orbits, file extraction, and setup of scene pairs for interferometric processing in chronological or single master modes.
- Extracting S1 bursts for area of interest extent including merging TOPS from neighboring slices and omission of unused bursts before interferometric processing.
- Automatic merging of multiple S1 swaths.
- Preprocessing, including removal of topographic phase, and filtering.
- Pair-wise processing of coherence, interferometric phase, and unwrapped phase in chronological (A-B, B-C, C-D, […]) or single master (A-B, A-C, A-D, […]) modes.
- Unwrapping error detection from reversely processed pairs.
- Postprocessing, including geocoding and generation of PNG, PS, Google Earth KML files.
- Efficient and consistent output file hierarchy and naming, providing analysis-ready stacks of WGS84-geocoded grid files for each dataset.

A growing set of modules to conduct more specialized tasks on stacks of data is available, including:
- Harmonization of stacks relative to the value at a reference point
- Identification of stable ground as point with highest coherence in the stack
- Unstable Coherence Metric
- GACOS Correction for atmospheric disturbances of the SAR signal
- Removal of large-scale trends
- Creating a summary PDF displaying maps of key datasets for each timestep (example in Fig.1)
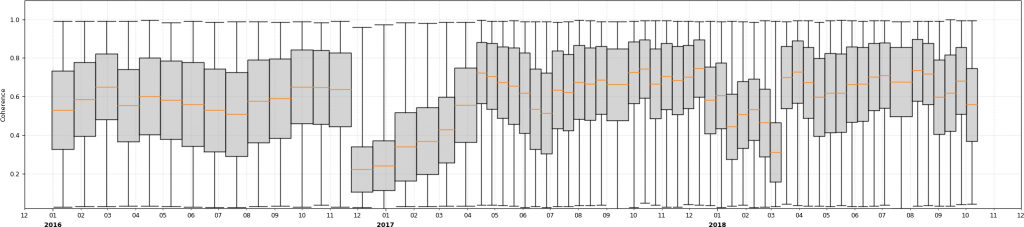
- Calculating statistics (range, median, mean, standard deviation, and root-mean-square, etc.) for each dataset in the stack. Optionally, box plots can be created from this data using an included Python script (example in Fig. 2)
Download and get involved
Visit OSARIS on GitHub to clone/download the tool.
Please use the issues section to request features, report bugs, etc.
Data
OSARIS works best with the full set of orbits available in its local environment. Download and extract the following archive to avoid long download time during processing.
S1 precise orbits archive (~12 GB)
Since you will probably want to obtain the file directly in your HPC environment, use this command in the terminal:
$ wget --content-disposition https://hu.berlin/s1-orbits
Tutorial
Basics: Setting up an OSARIS project from scratch
Core developer
References
Loibl, D., Bookhagen, B., Valade, S., Schneider, C., 2019. OSARIS, the “Open Source SAR Investigation System” for Automatized Parallel InSAR Processing of Sentinel-1 Time Series Data With Special Emphasis on Cryosphere Applications. Frontiers in Earth Science 7, 1–20. https://doi.org/10.3389/feart.2019.00172
Funding
Development of OSARIS is being conducted within the scope of the project ‘MOdel and Remote Sensing-based Analysis of glacier-related Natural Hazards in the Tien Shan mountains’ (MORSANAT). MORSANAT is funded by Geo.X, the Research Network for Geosciences in Berlin and Potsdam.
Acknowledgements
Thanks to Ziyadin Cakir who supported the conception of OSARIS with thoughtful comments and by sharing scripts.
Partnering Institutions